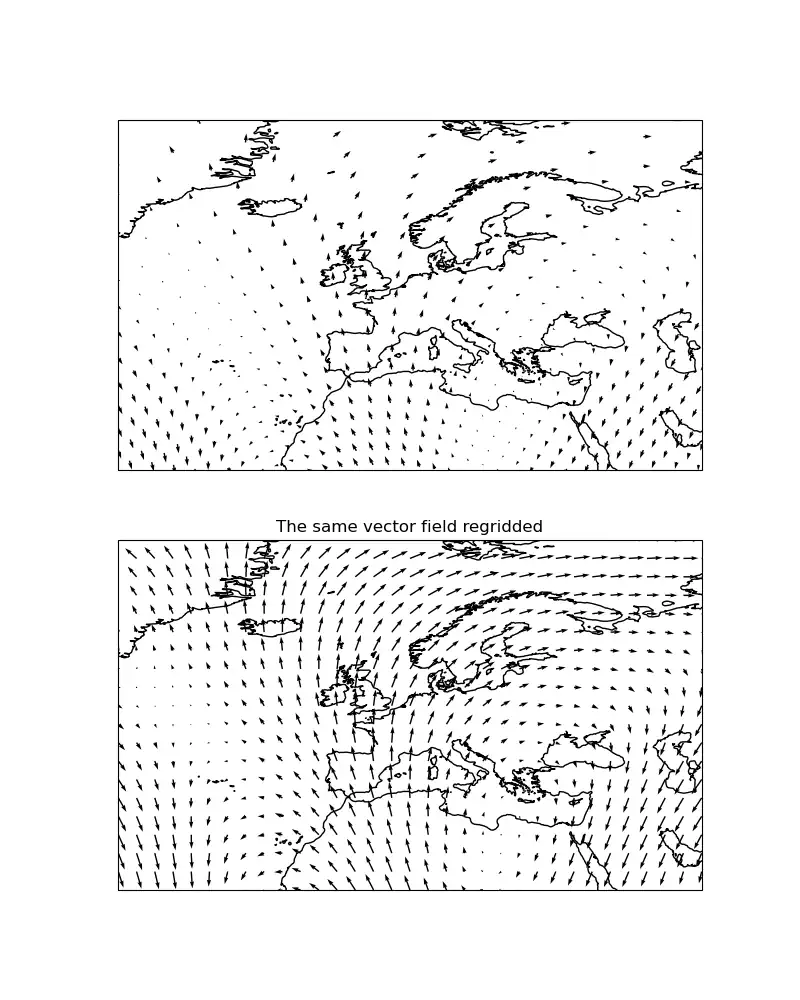
Cartopy is a Python package designed for geospatial data processing in order to produce maps and other geospatial data analyses. Cartopy makes use of the powerful PROJ, NumPy and Shapely libraries and includes a programmatic interface built on top of Matplotlib for the creation of publication quality maps.

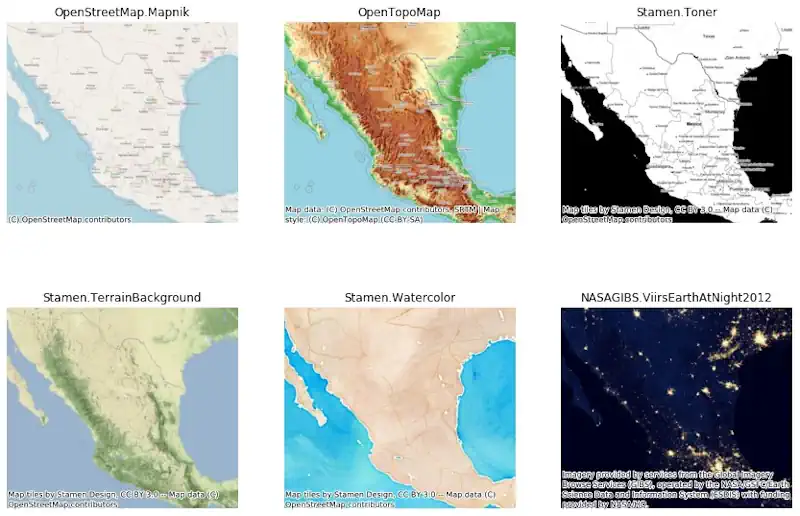
Contextily is a small Python 3 (3.7 and above) package to retrieve tile maps from the internet. It can add those tiles as basemap to matplotlib figures or write tile maps to disk into geospatial raster files. Bounding boxes can be passed in both WGS84 (EPSG:4326) and Spheric Mercator (EPSG:3857).
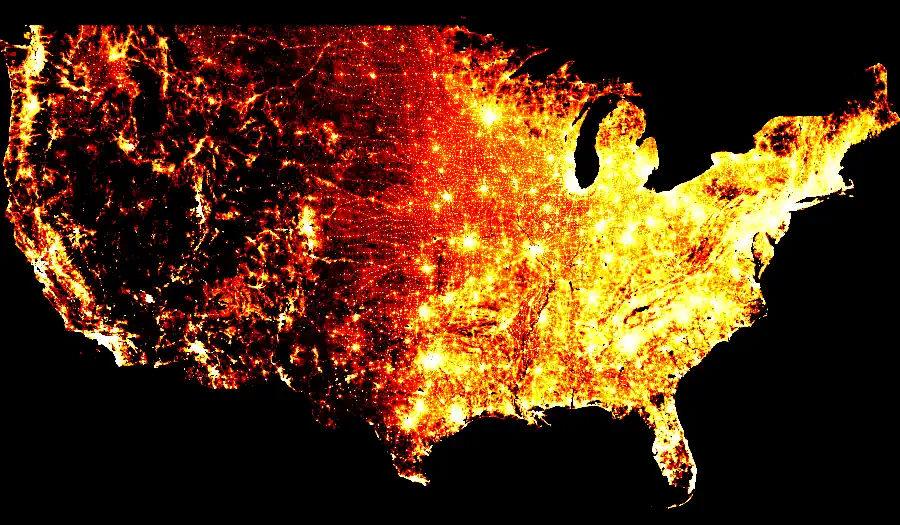
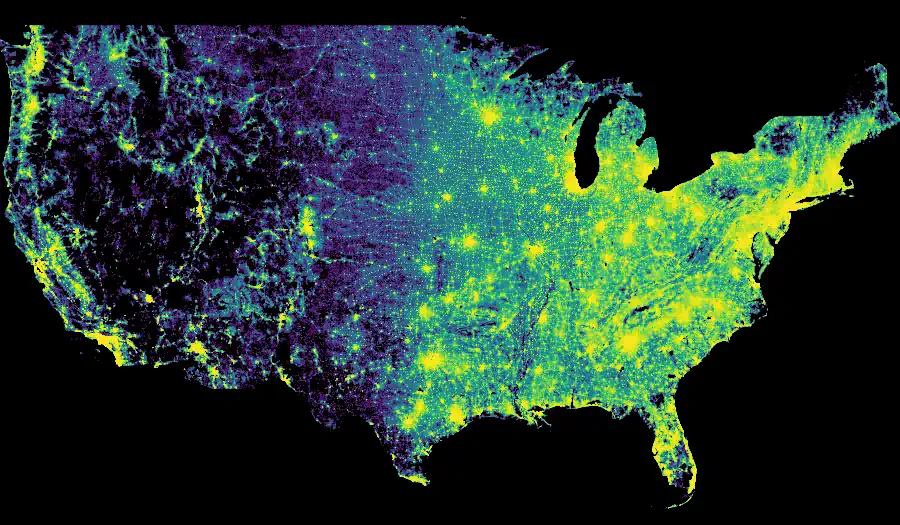
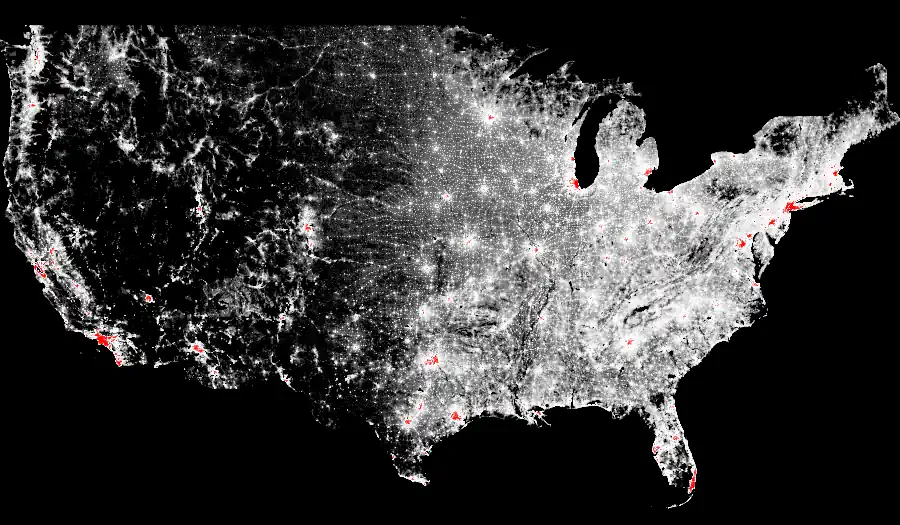
Datashader is a graphics pipeline system for creating meaningful representations of large datasets quickly and flexibly. Datashader breaks the creation of images into a series of explicit steps that allow computations to be done on intermediate representations. This approach allows accurate and effective visualizations to be produced automatically without trial-and-error parameter tuning, and also makes it simple for data scientists to focus on particular data and relationships of interest in a principled way.
The computation-intensive steps in this process are written in ordinary Python but transparently compiled to machine code using Numba and flexibly distributed across CPU cores and processors using Dask or GPUs using CUDA. This approach provides a highly optimized rendering pipeline that makes it practical to work with extremely large datasets even on standard hardware, while exploiting distributed and GPU systems when available.

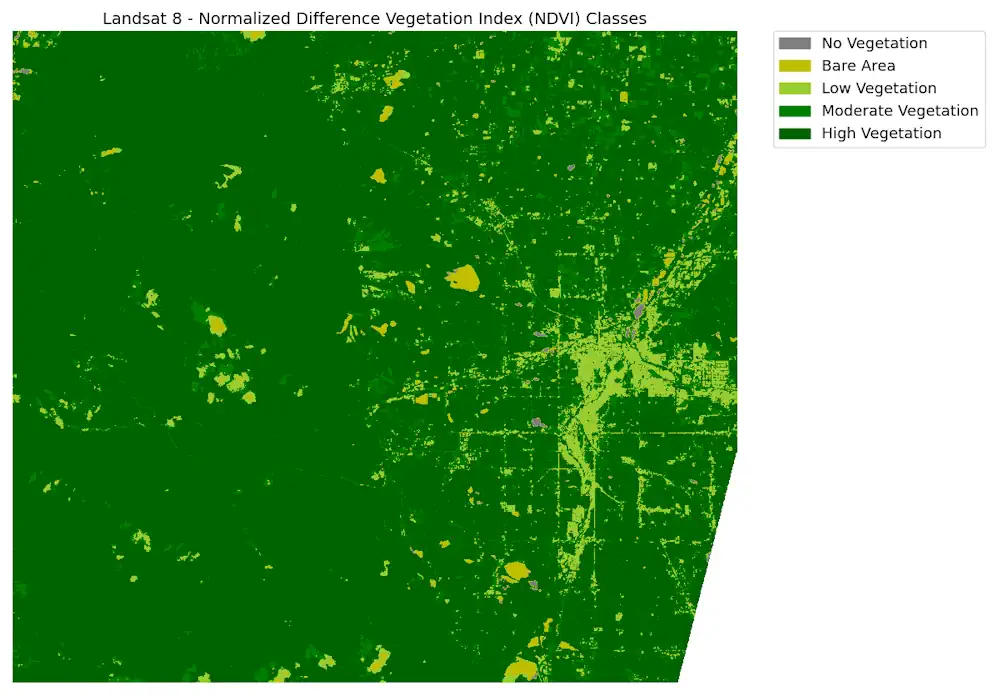
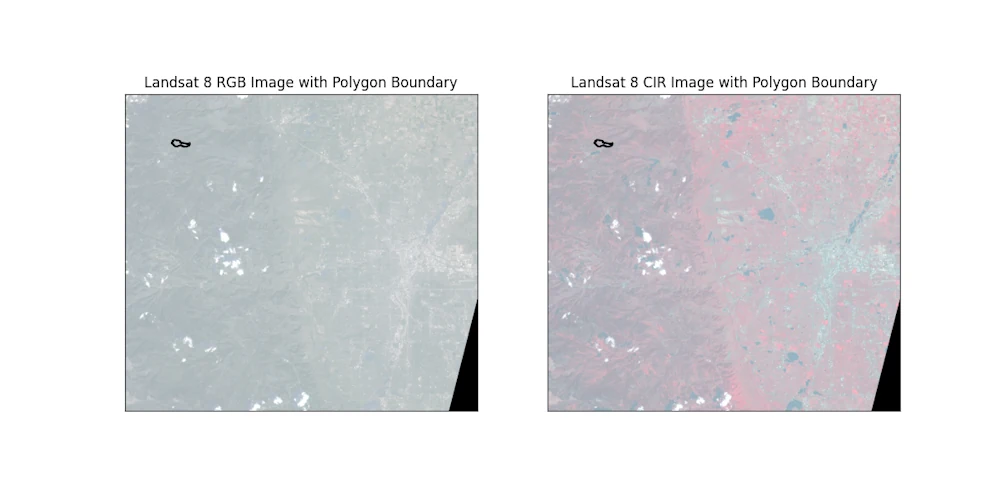
EarthPy is a python package that makes it easier to plot and work with spatial raster and vector data using open source tools. Earthpy depends upon geopandas which has a focus on vector data and rasterio with facilitates input and output of raster data files. It also requires matplotlib for plotting operations.

EOmaps is a python package to visualize and analyze geographical datasets. It is built on top of matplotlib and cartopy and provides an intuitive and easy-to-use interface to speed up and simplify the creation and comparison of maps.


Folium builds on the data wrangling strengths of the Python ecosystem and the mapping strengths of the leaflet.js library. Manipulate your data in Python, then visualize it in on a Leaflet map via folium.
A Python package for interactive mapping with Google Earth Engine, ipyleaflet, and ipywidgets.
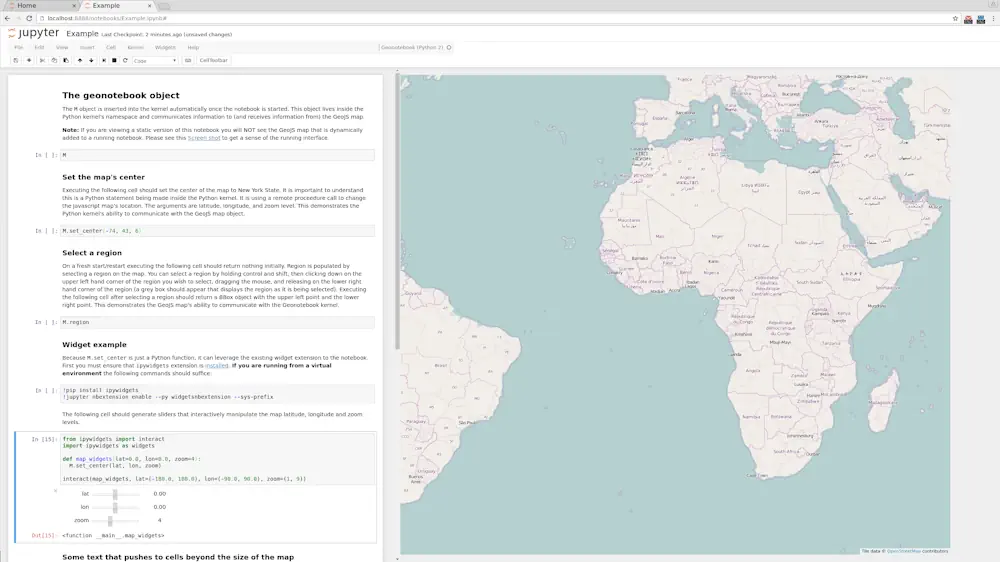
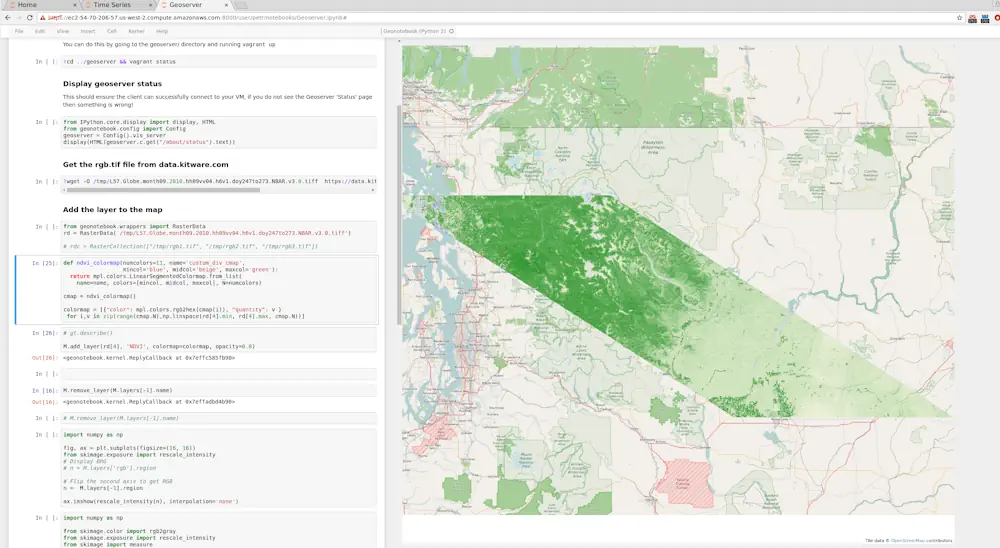
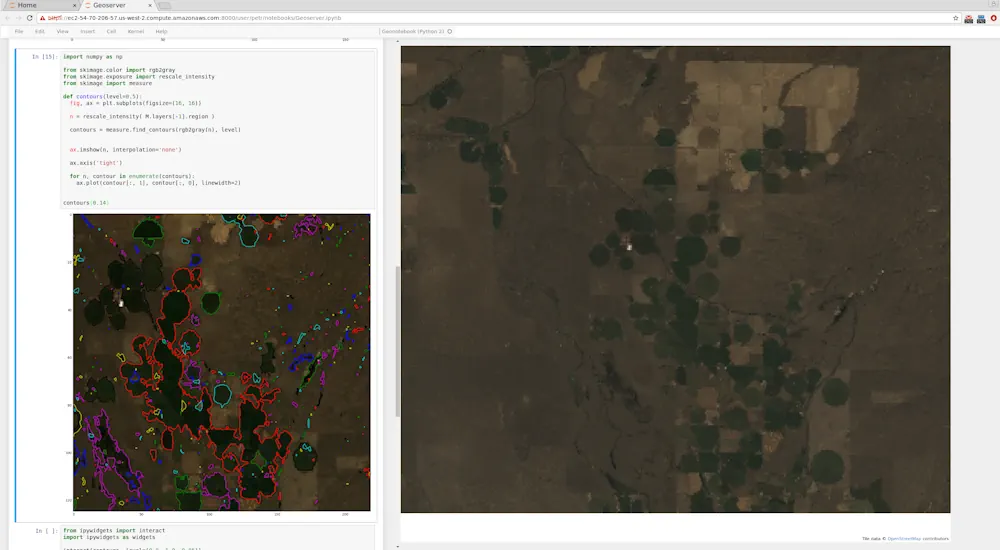
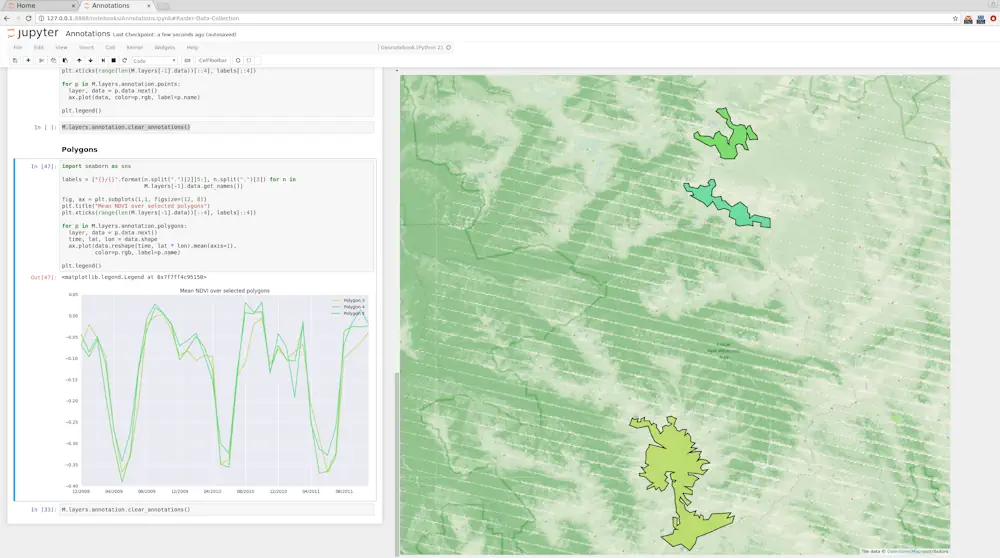
GeoNotebook is an application that provides client/server environment with interactive visualization and analysis capabilities using Jupyter, GeoJS and other open source tools. Jointly developed by Kitware and NASA Ames.
The geonotebook is designed to provide a dynamic interactive map for visualization and analysis of geospatial data in a familiar jupyter notebook format. On the left is a standard jupyter notebook. On the right a is a GeoJS map. Geonotebook connects these two allowing the python cells to visualize data on the map and regions of this data to be selected on the map for further analysis.

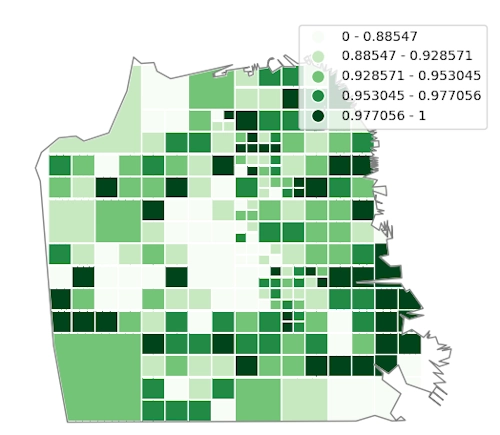
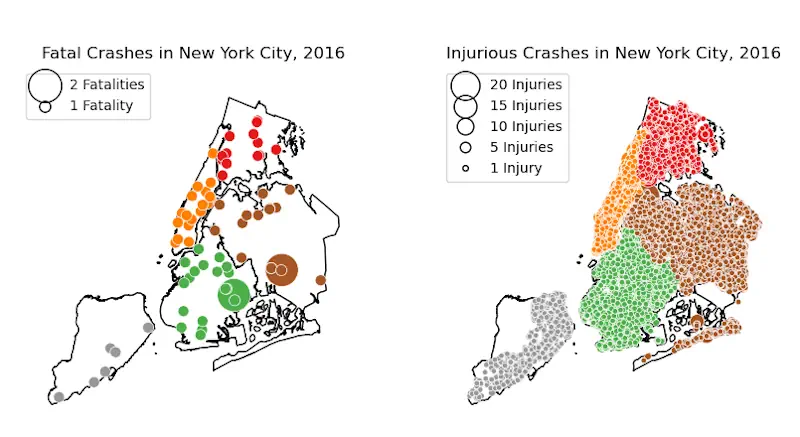
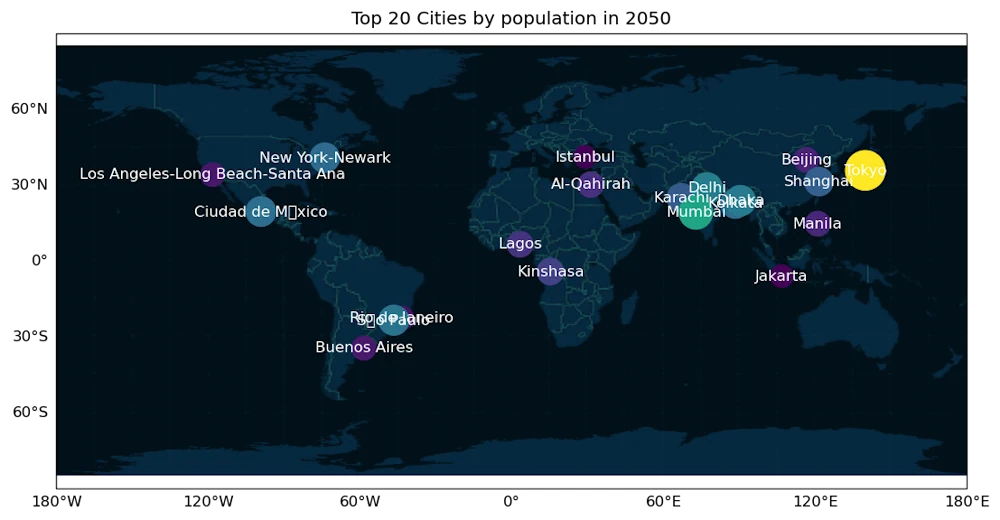
geoplot is a high-level Python geospatial plotting library. It’s an extension to cartopy and matplotlib which makes mapping easy: like seaborn for geospatial.

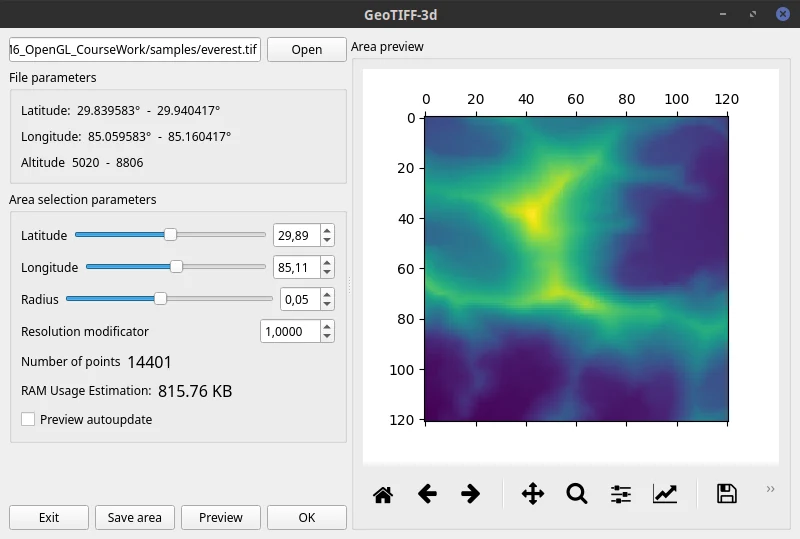
A simple program to visualize GeoTIFF files with Matplotlib and OpenGL.


GeoViews is a Python library that makes it easy to explore and visualize geographical, meteorological, and oceanographic datasets, such as those used in weather, climate, and remote sensing research. GeoViews is built on the HoloViews library for building flexible visualizations of multidimensional data. GeoViews adds a family of geographic plot types based on the Cartopy library, plotted using either the Matplotlib or Bokeh packages. With GeoViews, you can now work easily and naturally with large, multidimensional geographic datasets, instantly visualizing any subset or combination of them, while always being able to access the raw data underlying any plot.

This package allows you to create various layers directly from the GTFS and visualize the results in the most straightforward way possible.


Leafmap is a Python package for interactive mapping and geospatial analysis with minimal coding in a Jupyter environment. It is a spin-off project of the geemap Python package, which was designed specifically to work with Google Earth Engine (GEE). However, not everyone in the geospatial community has access to the GEE cloud computing platform. Leafmap is designed to fill this gap for non-GEE users. It is a free and open-source Python package that enables users to analyze and visualize geospatial data with minimal coding in a Jupyter environment, such as Google Colab, Jupyter Notebook, and JupyterLab. Leafmap is built upon several open-source packages, such as folium and ipyleaflet (for creating interactive maps), WhiteboxTools and whiteboxgui (for analyzing geospatial data), and ipywidgets (for designing interactive graphical user interfaces [GUIs]).
The mapwidget package provides a set of custom map widgets for creating interactive maps in a Jupyter environment using different JavaScript mapping libraries, such as Cesium, Leaflet, Mapbox, MapLibre, and OpenLayers. The widgets are built on top of the anywidget Python package.
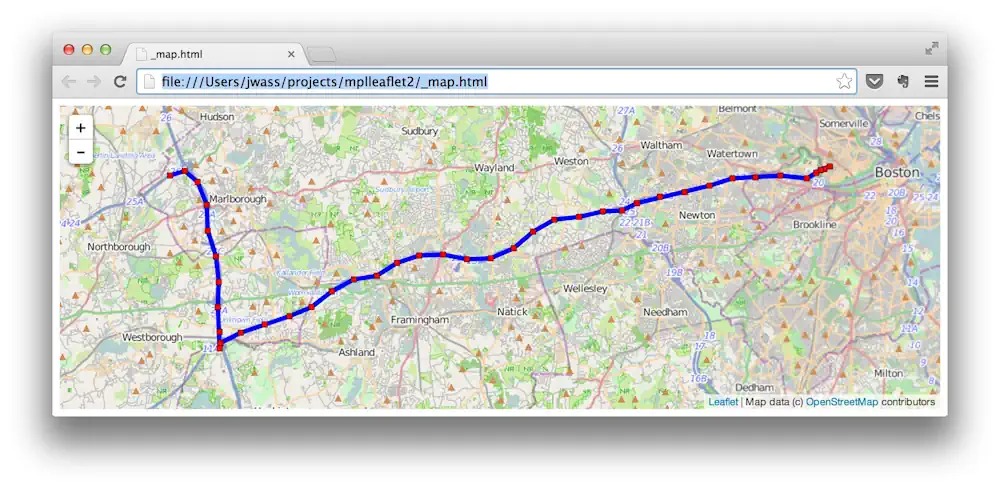
Mplleaflet is a Python library that converts a matplotlib plot into a webpage containing a pannable, zoomable Leaflet map. It can also embed the Leaflet map in an IPython notebook. The goal of mplleaflet is to enable use of Python and matplotlib for visualizing geographic data on slippy maps without having to write any Javascript or HTML. You also don’t need to worry about choosing the base map content i.e., coastlines,
roads, etc.
PyGMT is a library for processing geospatial and geophysical data and making publication-quality maps and figures. It provides a Pythonic interface for the Generic Mapping Tools (GMT), a command-line program widely used across the Earth, Ocean, and Planetary sciences and beyond.


The PyVista project is a collection of Free Licensed Open Source Software (FLOSS) around 3D visualization and mesh analysis in Python. The flagship PyVista library provides the core 3D plotting and mesh types used across the PyVista project.
At its core, PyVista is a pure Python library – However, its dependencies, namely the Visualization Toolkit (VTK) is in C++. By wrapping the VTK library’s Python bindings into the PyVista suite, we have created a streamlined and intuitive toolset for 3D Visualization and mesh analysis/processing. Since PyVista is purely Python and VTK has wheels deployed for most major platforms and Python versions, PyVista can be used across platforms – it is being used across UNIX and Windows platforms everyday!