Scientists led by the China Agricultural University have created a national-scale map and dataset of ground-mounted PV power stations in China. The data is based on Sentinel-2 imagery from 2020 and has a spatial resolution of 10 meters. According to the researchers, the publicly available data set can assist capacity estimation and prediction tasks, site selection, test energy policies, and more.
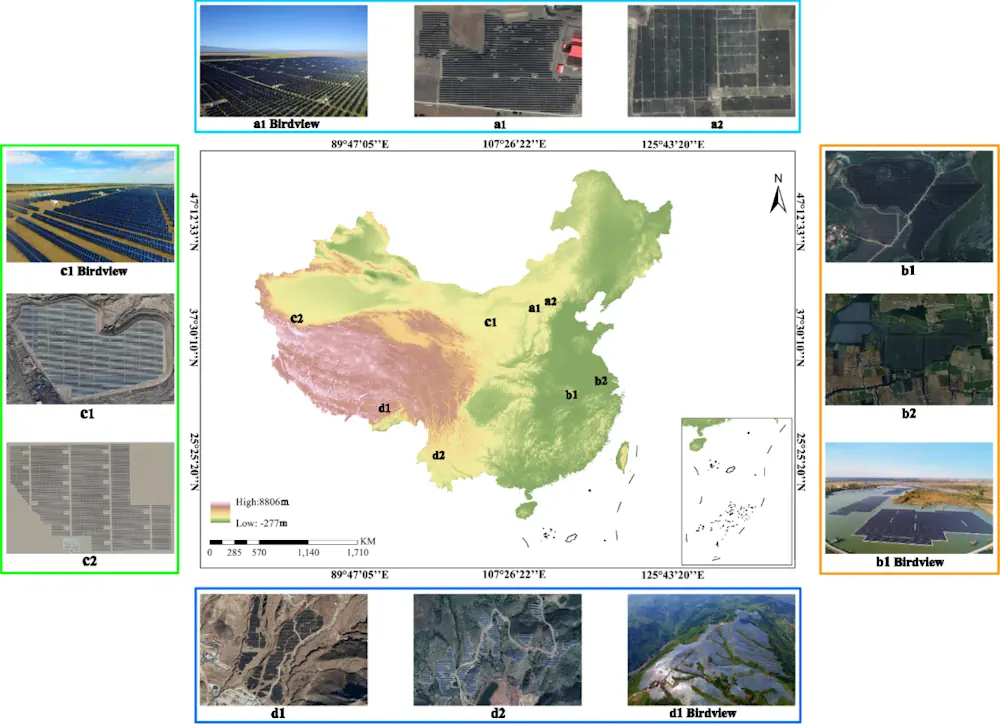
“There is a lack of a national map of China’s PV power stations with a higher spatial resolution (i.e., 10 meters) that could provide a global understanding of PV’s spatial deployment patterns,” they explained. “Considering that the large-scale grounded-mounted PV power stations almost cover more than 90% of the total PV capacity in China, we attempt to provide the first publicly available 10-m national map of ground-mounted PV power stations in this dataset.”
To create the dataset, the research group used multi-spectral remote sensing data from the European Space Agency’s Sentinel-2 satellites, together with digital elevation model (DEM) information from Google Earth Engine (GEE). Those were processed via the GEE cloud computing platform.
The processing was based on a random forest (RF) classifier, a machine-learning method consisting of many decision trees. It was trained on visual inspection of 320,000 PV and 320,00 non-PV samples. As PV stations and the surroundings look different across the vast land of China, RF was used on a province level. In some cases, where even the provinces were too big, they were further divided into sub-sections.
“During the mapping process, it would be difficult to produce an accurate map with automatic classification once and only once. In this situation, we resorted to active learning,” they said. “The core idea of active learning is described as follows. Firstly, train a classifier with initial labeled data, then use the trained classifier to predict the entire dataset. Afterwards, the wrongly predicted unlabelled data would be sent to experts. Then, the classifier would be re-trained with both the initial and the newly labeled data. The above process would be run in an iterative way until a satisfactory classification result would be achieved.”
The group validated the national-scale testing dataset by selecting a total of 5,000 positive samples and 5,000 negative samples and asked the model to identify them. The model has reached an accuracy of 88.36% for samples containing PV and 89.94% for non-PV samples.