The impacts of climate change are being felt all over the world, but how will it impact how your hometown feels? An interactive web application from the University of Maryland Center for Environmental Science allows users to search 40,581 places and 5,323 metro areas around the globe to match the expected future climate in each city with the current climate of another location, providing a relatable picture of what is likely in store.
A spatial ecologist, Fitzpatrick used climate-analog mapping, a statistical technique that matches the expected future climate at one location—your city of residence, for instance—with the current climate of another familiar location, to provide a place-based understanding of climate change. He used the most recent available data from the Intergovernmental Panel on Climate Change (IPCC), the United Nations body for assessing the science related to climate change, to illustrate anticipated temperature changes over 30 years under two different scenarios.
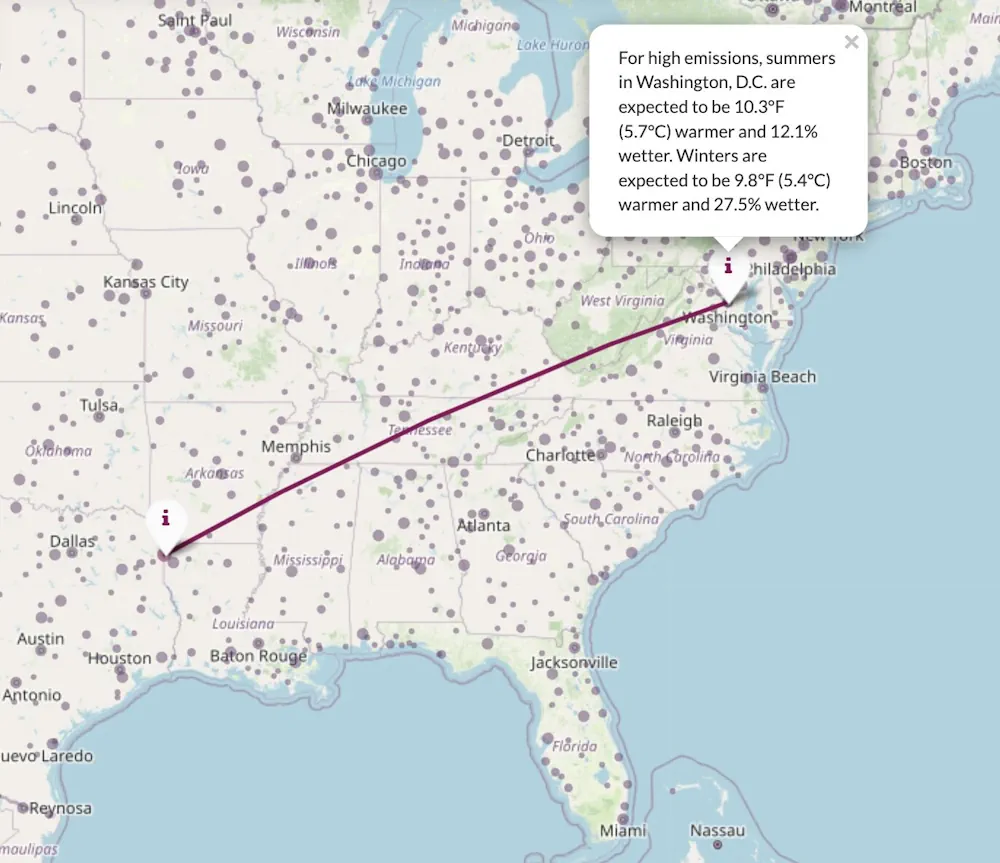
The first scenario that users can search is similar to our current trajectory and assumes very high greenhouse gas emissions, in which the planet is on track to warm around 9 degrees F by the end of this century. This scenario would make the Earth warmer than it likely has been in millions of years. The second scenario is similar to what the planet would feel like if nations pursue Paris Climate Accord goals. Under that scenario, the planet warms by about 3 degrees F by immediately and drastically reducing human-caused greenhouse gases emissions.