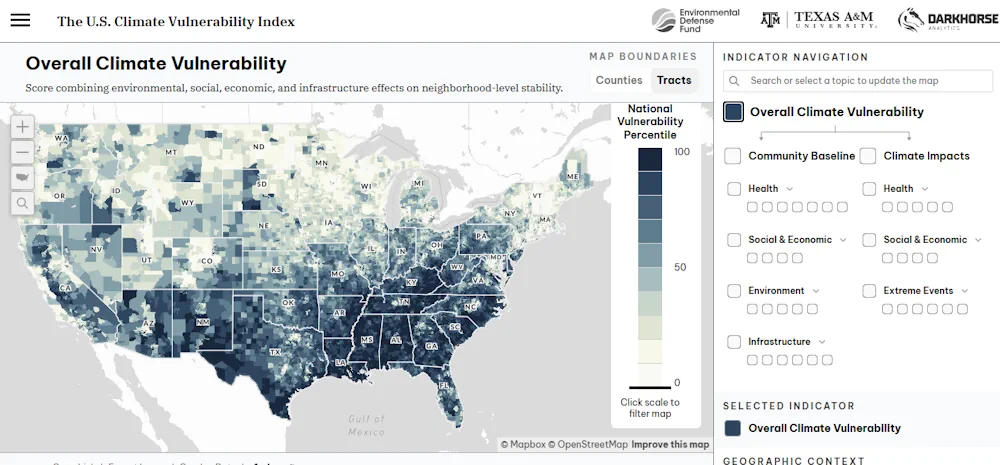
If you’ve been wondering what climate change means for your neighborhood, you’re in luck. The most detailed interactive map yet of the United States’ vulnerability to dangers such as fire, flooding, and pollution was released in early October by the Environmental Defense Fund and Texas A&M University.
The fine-grained analysis spans more than 70,000 census tracts, which roughly resemble neighborhoods, mapping out environmental risks alongside factors that make it harder for people to deal with hazards. Clicking on a report for a census tract yields details on heat, wildfire smoke, and drought, in addition to what drives vulnerability to extreme weather, such as income levels and access to health care and transportation.
Even in cities where climate risk is comparatively low, like Seattle, the data shows a sharp divide. North Seattle is relatively insulated from environmental dangers, whereas South Seattle — home to a more racially diverse population, the result of a history of housing covenants that excluded people on the basis of race or ethnicity — suffers from air pollution, flood risk, and poorer infrastructure. Similar maps of local climate impacts have been released before, including by the Environmental Protection Agency and the White House Council on Environmental Quality, but the new tool is considered the most comprehensive assessment to date. While it includes Alaska and Hawai‘i, it doesn’t cover U.S. territories like Puerto Rico or Guam.