In the wake of last month’s disastrous flooding in southern Brazil, researchers are asking residents to use their smartphone cameras to document the damage and high-water marks. The data collected will help scientists map flood risk and inform decisions on where to rebuild.
When Lucas George Wendt arrived in Lajeado in late May, the water had already started to recede.
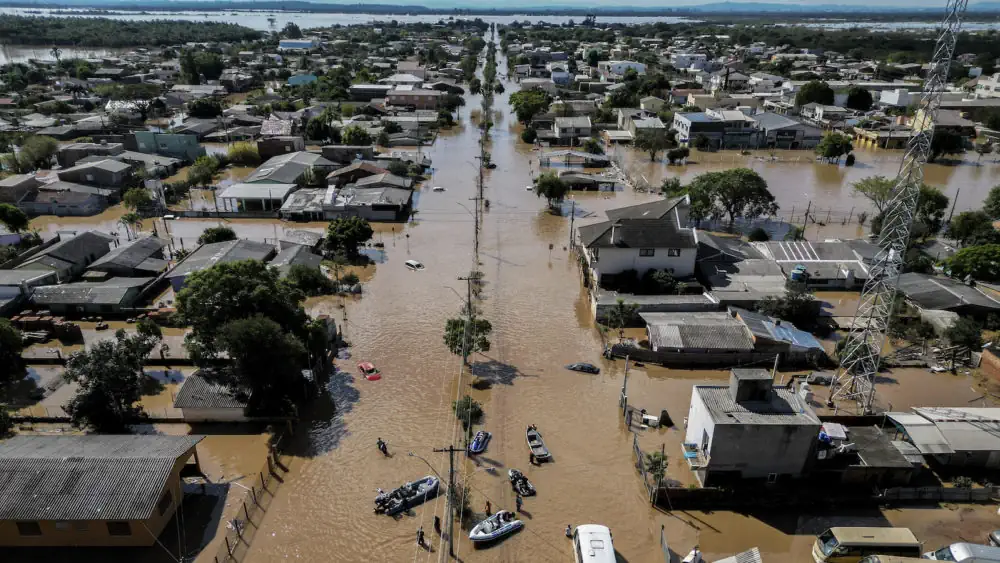
Just days before, the peaks of roofs and the tops of trees were some of the only things visible above the murky brown water that had covered his hometown. Located in the Taquari Valley, Lajeado, population 85,000, was one of the communities hit hardest by the historic flooding that tore through Brazil’s southernmost state, Rio Grande do Sul, between late April and mid-May, displacing more than 650,000 people, killing 173, and injuring 806.
When Wendt arrived, 38 people were still missing. Backhoes were scooping mud from blocked roads, city workers were clearing sidewalks with pressure washers, and volunteers were sorting through donations of clothing, food, personal hygiene products, and bottled water.
Wendt — who now lives in the state capital of Porto Alegre and is studying for his master’s degree in information science while working in communications at the University of Taquari Valley (Univates) — had come home to check in on family and friends. But he also wanted to do something to help while there.
Last September, he had heard about a Univates mapping project led by researcher Sofia Royer Moraes, an environmental engineer who studies extreme flooding events in the Taquari-Antas River Basin. At the time, the Taquari River, which runs through Lajeado, had overflowed, leaving the region to deal with the worst flooding in 82 years, the displacement of at least 359,000 people, and the deaths of 48. Residents of the Taquari Valley were used to dealing with annual flooding, but this event was different. Studies showed that climate change had worsened the flood, which meant that future floods would bring even more deaths.
It was then that Moraes decided she could do something to help. She created what is known as a Citizen Map, using Google Maps as a platform for ordinary people using their smartphones to pinpoint the floodwaters’ reach. These so-called citizen scientists were instructed to take photos of what they saw and send them, along with their geolocation, to a WhatsApp group monitored by Moraes and her team. Combining that information with historic flood data from the area, the team could model what might happen during future floods, helping residents who had already lost everything to decide where it would be safest to rebuild their lives. The models could also give authorities the information they needed for better urban planning and allocation of resources.
Fascinated by the potential of the project, Wendt knew he wanted to pitch in. By now, Univates was partnering with the Federal University of Rio Grande do Sul, and this time, the goal was to map the entire state of Rio Grande do Sul.
As he drove around his hometown, Wendt snapped photos of everything he thought would benefit the Citizen Map: a white cross smeared with mud where a church once stood; a lone house standing among pieces of hundreds of others that had washed away; markings on a wall in the city center that registered the water’s height.
Wendt’s more than 20 data points collected at the end of May are now among the more than 600 on the constantly updated Citizen Map, a contribution he knew would help others but that he was surprised to see helped him as well.
“It helped me understand all of these connections,” he said. “If it’s raining in one place, what is the impact that’s going to have downriver? Someone who participates in this type of citizen science initiative ends up being more aware, more secure, and more empowered to deal with this type of situation, which, unfortunately, we know we can expect more of in the near future.”
In the context of climate change, the team behind the Citizen Map wants Brazilian authorities to use this data to rethink everything from urban planning and post-disaster recovery to the availability of health care and clean drinking water in the aftermath of climate-change-induced catastrophes. They also hope that by educating people about what’s going on around them, they’ll not only become more interested and invested in participating in solutions to local flooding, but also feel prepared to face what’s to come.
The first Citizen Map that Moraes created last September collected data only on the perimeter of the affected area to determine what parts of the Taquari Valley would be considered at high risk of future flooding. Around 600 data points were sent in by 150 citizen scientists.
Some neighborhoods that participated heavily in mapping the September floods haven’t been involved in creating the new map, but that’s likely because those areas are still difficult to access, or not accessible at all. And while the state continues to recover from the emergency — it initially focused on saving people and animals from fast-moving waters and collapsing buildings and is now setting people up in shelters and other more permanent housing — data collection is expected to be slow.
“Data will likely start to come in quicker in another two or three weeks,” says Moraes. “The actual modeling of the Citizen Map should happen in July and August, and it will be available for consultation then too.”
In addition to using perimeter data, which shows the horizontal spread of water, the new map will also use data related to the height of floodwaters, often measured by water and mud stains left on the walls of people’s homes and local businesses.
The Citizen Map is currently very simple and powered by Google, but the team plans to partner with the open-mapping nonprofit Humanitarian OpenStreetMap Team to improve the visuals of their final product. “Google Maps has good visuals, but they’re fairly standard,” says Wendt. “We want our map to be as easy to understand as possible to make sure it can be used by anyone who wants to consult it to keep themselves safe and make the best decisions possible for their future.”
“It’s so important for people to understand their surroundings, to know if they’re in an area of risk,” says Moraes. “And they want to understand. They want to be engaged.”
While anyone with a smartphone can collect data for the newest edition of the Citizen Map, most participants so far are professors and their students from universities around the region. The hope is that more people will join in once the situation on the ground starts to improve.
“I really support citizen science initiatives because they are exactly what people need to learn and feel empowered,” says Marta Angela Marcondes, an expert in water resources and coordinator of the Water Pollutant Index Project at the Municipal University of São Caetano do Sul. “I really believe in processes of prevention and not remediation, and civil society is a key component in making this happen.”