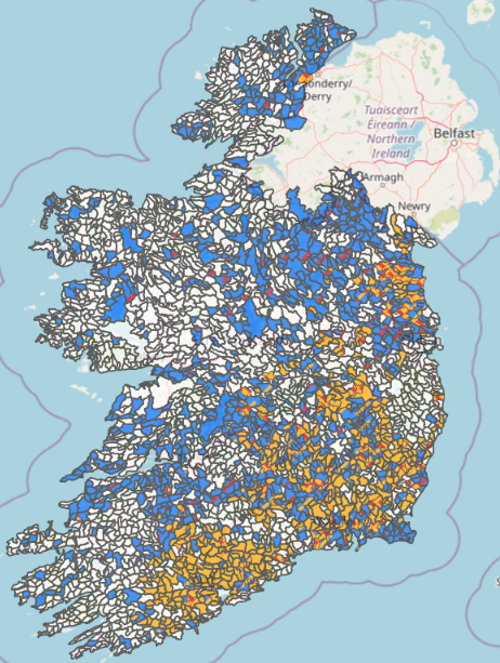
The Environmental Protection Agency (EPA) has developed a map which highlights how water quality is affected by farming activity in different areas of the country. The map, which was published this month, is divided into sub-basins, which are colour-coded to highlight different issues related to farming activity. A single sub-basin may be colour-coded with different colours, meaning there is more than one issue in that area. The map is available through the EPA Geoportal website, under water maps. The map is interactive, allowing users to zoom in and get a clearer picture of issues arising in their area.