Geomaticians

Tool | Resource

New Map Shows Where Damaging Earthquakes Are Most Likely To Occur In US 

New Map Shows Where Damaging Earthquakes Are Most Likely To Occur In US 

Nearly 75% of the U.S. could experience damaging earthquake shaking, according to a recent U.S. Geological Survey-led team of more than 50 scientists and engineers. This was one of several key findings from the latest USGS National Seismic Hazard Model (NSHM). The model was used to create a color-coded map that pinpoints where damaging earthquakes ...
phys.org

IMD Launches Weather Forecast Portal For Farmers & MAUSAM App

New Delhi, Jan 15 (UNI) India Meteorological Department (IMD) on the 150th year of its establishment, on Monday launched the weather forecast portal ‘Panchayat Mausam Seva for farmers’ to support farmers with timely weather alerts and warnings for planning agricultural activities accordingly. “Through this portal, weather forecasts in English, Hindi and twelve regional languages will ...
uniindia.com

New GISTDA App Warns Of Hot Spots To Reduce Wildfire Risks

The GISTDA is continuing to develop its application called FAIPA, “Forest Fire” in English, to notify hotspots at the sub-district, district, and provincial levels, using real-time or near real-time satellite data for primary users, including agencies like the Department of Disaster Prevention and Mitigation, volunteer groups, and local residents. The application provides nationwide hotspot data, ...
nationthailand.com
Newly Released Avian Data Monitoring Portal Available To Public And Researchers

Newly Released Avian Data Monitoring Portal Available To Public And Researchers

A newly released Avian Data Monitoring Portal brings together more than a decade of aerial survey photos along the northern Gulf of Mexico to provide an easily searchable database for researchers, natural resource managers, and the public. Found at avianmonitoring.com, the portal will help coastal managers, coastal restoration engineers, researchers, and others not only see ...
press-herald.com
Mecklenburg County GIS Time Machine Going Forward By Seeing Where We’ve Been

Mecklenburg County GIS Time Machine: Going Forward By Seeing Where We’ve Been

Mecklenburg County Geospatial Information Services (GIS) is starting off 2024 by reflecting on our growth and tree canopy. The Mecklenburg County GIS Time Machine is a Historical Aerial Photo Viewer that allows the user to zoom into a location of interest and view land use changes over time through the display of historical aerial photography ...
news.mecknc.gov

Cartografia E Telerilevamento, Online L’aggiornamento Dei Dati Territoriali

Si aggiorna e si sviluppa il patrimonio foto-cartografico della Toscana. Sono disponibili online nuovi prodotti derivati dai più recenti rilievi aerei che consentiranno una conoscenza ancora più approfondita di tutto il territorio regionale e delle sue trasformazioni. Questo grazie a specifici progetti di telerilevamento realizzati con risorse interamente regionali. Si tratta, nello specifico, di aggiornamenti ...
toscana-notizie.it
This Website Will Help You Find The Best Driving Roads In The World

This Website Will Help You Find The Best Driving Roads In The World

The search for the perfect driving road never ends. Besides being a subjective matter, how does one even begin such a monumental task as seeking out roads around the world? Actually, it may not be as daunting as you think, thanks to this very cool website that not only highlights twisty roads, but delivers gobs ...
motor1.com
Electricity Maps

Electricity Maps

A real time and historical visualisation of the Greenhouse Gas Intensity (in terms of CO2 equivalent) of electricity production and consumption around the world. This project aims to provide a free, open-source, and transparent visualisation of the carbon intensity of electricity consumption around the world.
electricitymaps.com
WisDOT interactive map shows where infrastructure funding is awarded

WisDOT Interactive Map Shows Where Infrastructure Funding Is Awarded

The Wisconsin Department of Transportation (WisDOT) announced it launched an interactive map and dashboard that will show where federal discretionary grants were awarded to municipalities across the state. As of Monday, the department said more than $888 million would come to Wisconsin for transportation projects in all corners of the state. “WisDOT is committed to ...
dailyreporter.com

Portal To Map Health Facilities Launched

The Department of Health Services (DoHS), on Wednesday launched the Geo Web Portal for Health Centres. Dr. HC Lyndem, the Director of DHS(MI), inaugurated the portal at the DHS headquarters in Shillong. The portal provides rich information through space technology mapping. It plays a crucial role in assessing existing health resources by considering factors such ...
themeghalayan.com
Soil Atlas Depicts The Distribution Of Chemical Elements In Swiss Soils

Soil Atlas Depicts The Distribution Of Chemical Elements In Swiss Soils

Agroscope and the Federal Office for the Environment have published the first Geochemical Soil Atlas of Switzerland. It provides an overview of the large-scale distribution of 20 naturally occurring chemical elements in Swiss soils. The soil atlas will help the cantonal environmental protection agencies assess soil pollution levels and take action where necessary. The Geochemical ...
admin.ch
Neue Karte Zeigt Radon-situation In Wohnungen

Neue Karte Zeigt Radon-situation In Wohnungen

Man kann es weder sehen noch riechen oder schmecken: das radioaktive Gas Radon. In geringen Mengen ist es in jedem Gebäude vorhanden. Erhöhte Radon-Werte stellen ein ernst zu nehmendes Gesundheitsrisiko dar, denn dieser Innenraumschadstoff gehört – nach dem Rauchen – zu den häufigsten Ursachen von Lungenkrebs. Eine neue Karte des Bundesamtes für Strahlenschutz zeigt die ...
pro-physik.de
Presentan Mapas De Siete Cultivos Con Información Georreferenciada De Superficie Sembrada En Córdoba

Presentan Mapas De Siete Cultivos Con Información Georreferenciada De Superficie Sembrada En Córdoba

La Bolsa de Cereales de Córdoba (BCCBA), con el apoyo e infraestructura de IDECOR, presentó sus mapas de siete cultivos en la provincia de Córdoba. Concretamente, se trata de información georreferenciada de la superficie sembrada de los cultivos de alfalfa, garbanzo, girasol, maíz, maní, soja y sorgo en territorio cordobés. La producción y publicación de ...
agroverdad.com.ar
Áncash Realizan Lanzamiento Del Observatorio Territorial Www.Infogel.Pe

Áncash: Realizan Lanzamiento Del Observatorio Territorial Www.Infogel.Pe

En las instalaciones de la Cámara de Comercio de Áncash, se realizó el lanzamiento del Observatorio Territorial INFOGEL, portal web que permite recopilar, analizar y difundir información relevante a través de datos espaciales, para tener conocimiento de lo que acontece en 20 distritos del área de influencia operativa de Antamina. Instituciones públicas de Áncash y ...
ancashnoticias.com
Satellite Imagery Analysis Firm Launches Free Greenhouse Gas Tracker

Satellite Imagery Analysis Firm Launches Free Greenhouse Gas Tracker

French satellite imagery analysis provider Kayrros launched a free version of its global methane tracking map Nov. 29 to help hold governments and businesses to account for their emissions. The public platform uses data from the European Space Agency’s Sentinel-5P satellite and a sensor on the International Space Station to provide daily snapshots of the ...
spacenews.com
New Heat Map Explores Potential Benefits Of Philly Tree Plan With Block-by-Block Detail

New Heat Map Explores Potential Benefits Of Philly Tree Plan With Block-by-Block Detail

As Philadelphia plants thousands of trees to help cool heat-stricken sections of the city, residents can use a new online tool to see how the decade-long project might help their neighborhoods. You can slide between two overlapping maps of the city: one that reveals how bad the summer heat problem is on a detailed, block-by-block ...
billypenn.com
Près De 60 % Des Bâtiments Cartographiés Dans Le Cadre De La Plus Grande Recherche Canadienne Sur L'accessibilité Ne Sont Pas Accessibles

Près De 60 % Des Bâtiments Cartographiés Dans Le Cadre De La Plus Grande Recherche Canadienne Sur L’accessibilité Ne Sont Pas Accessibles

Une nouvelle recherche publiée aujourd’hui par AccessNow, une entreprise de technologie de l’accessibilité, en collaboration avec l’Université de Calgary, Lésions médullaires Canada et BDO, révèle que près de 60 % des bâtiments cartographiés à Vancouver, Calgary et Ottawa ne sont pas entièrement accessibles et met en évidence les zones où les villes et les propriétaires ...
ecranmobile.fr
Desarrollaron Mapas Digitales De Cada Zona Vitivinícola Argentina Para Consultar De Manera Gratuita

Desarrollaron Mapas Digitales De Cada Zona Vitivinícola Argentina Para Consultar De Manera Gratuita

El inmenso trabajo fue encabezado por el Consejo Federal de Inversiones (CFI) junto con COVIAR y permite consultar cada perfil geológico y climático del país, mediante una plataforma de acceso libre ya disponible. Identificar todas las variables climatológicas y geológicas de cada rincón del país en donde crece una uva no solo es posible, sino ...
uvasargentinas.com.ar
Investigadores De La UNAM Diseñan Algoritmo Capaz De Detectar Las Cenizas Del Volcán Popocatépetl

Investigadores De La UNAM Diseñan Algoritmo Capaz De Detectar Las Cenizas Del Volcán Popocatépetl

Investigadores de la UNAM, bajo la dirección del maestro en Geografía Víctor Manuel Jiménez Escudero, han desarrollado un algoritmo innovador que puede detectar con precisión las emisiones de ceniza provenientes del volcán Popocatépetl, conocido por su constante actividad, uno de los más dinámicos y vigilados del mundo. El Laboratorio Nacional de Observación de la Tierra ...
es.wired.com
Restoring Ecosystems To Boost Biodiversity Is An Urgent Priority – Our ‘Eco-index’ Can Guide The Way

Restoring Ecosystems To Boost Biodiversity Is An Urgent Priority – Our ‘Eco-index’ Can Guide The Way

Biodiversity continues to decline globally, but nowhere is the loss more pronounced than in Aotearoa New Zealand, which has the highest proportion of threatened indigenous species in the world. Planning large-scale biodiversity restoration projects – whether they’re run by NGOs, governments or Indigenous groups – requires high-quality data. Despite the rising demand, however, accessible biodiversity ...
theconversation.com
An Open-Source Tool To Assist In Multi-Hazard Risk Assessment

An Open-Source Tool To Assist In Multi-Hazard Risk Assessment

RiskChanges is an open-source cloud-based spatial decision support tool using a dynamic and comprehensive approach to multi-hazard risk assessment. It is designed to support orgaizations in assessing and managing risks associated with multiple hazards at the local level to select optimal risk reduction alternatives. RiskChanges was developed by the University of Twente in collaboration with ...
reliefweb.int
Gdańsk Ma Nowy Geoportal

Gdańsk Ma Nowy Geoportal

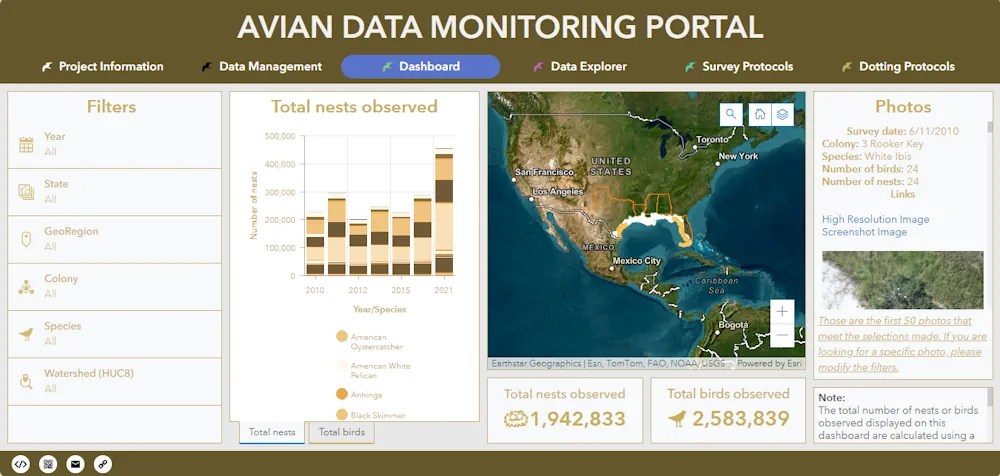
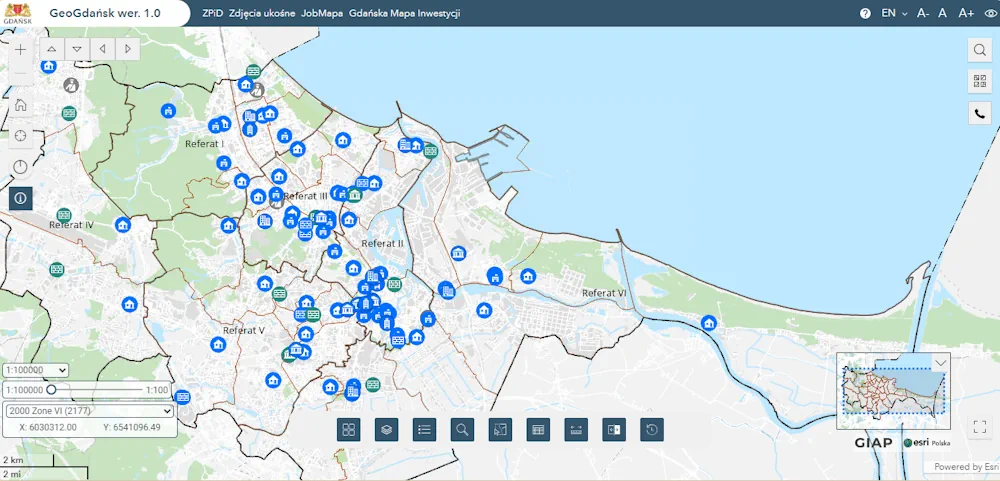
Zaprezentowane właśnie narzędzie zapewni mieszkańcom i odwiedzającym Gdańsk dostęp do bardziej zaawansowanych, wszechstronnych map oraz informacji o mieście – pozwoli na jego odkrywanie w zupełnie nowy sposób. GeoGdańsk to kompleksowy i intuicyjny portal mapowy, który oferuje użytkownikom znacznie więcej niż tradycyjne mapy on-line. Portal umożliwia szybkie przeglądanie map, lokalizowanie ważnych punktów, dostęp do informacji o ...
geoforum.pl
Track-a-Truck Interactive Map Available For Customers

Track-a-Truck Interactive Map Available For Customers

Track-a-Truck is a pilot program with the City of Hendersonville. This online application available on the City’s website shows the near real-time location of garbage and recycling trucks as they drive along their collection routes. It is also a way to see what day of the week your garbage will be collected in an interactive ...
hendersonvillenc.gov
City Planning Announces NYC Street Map To Show Historical Information About City

City Planning Announces NYC Street Map To Show Historical Information About City

On October 12, 2023, Department of City Planning Director Dan Garodnick announced that the NYC Street Map will now include access to the original street mapping of the City. Users can see the width, angles, and other dimensions of the City’s over 32,000 streets when utilizing the interactive map for requests to change their street, ...
citylandnyc.org
UM-led Project Creates Mapping Tool Using Satellites, 1950s Photo Archive

UM-led Project Creates Mapping Tool Using Satellites, 1950s Photo Archive

When the Cold War grew chillier around 1950, the U.S. military worried about a communist land invasion of the United States. So pilots were employed – many of them veterans of World War II – to photograph the entire country using aircraft. This 70-year-old archive of overlapping photos was taken at different angles, providing topographic ...
umt.edu
London Pollution Maps Shows Worst Areas For Road Run-Off Pollution

London Pollution: Maps Shows Worst Areas For Road Run-Off Pollution

A new online map has been created to show where contaminated rain water from roads is polluting rivers in London. Environmental charity Thames21 has launched the site to help local authorities, as well as local communities, identify problem areas. Thames21 said contaminated run-off was caused by oil spills and tyre wear on the roads which ...
bbc.com

Global Inventory Map Of Floating Photovoltaics

A group of researchers led by China’s Nanjing University has created a global-scale inventory map to determine the spatio-temporal distribution of floating photovoltaics. “Existing statistical reports on water-surface photovoltaics (WSPV) only provide aggregated summary statistics but lack spatiotemporal information, which hinders the environmental assessment and policy management,” the research’s lead author, Shanchuan Guo, told pv ...
pv-magazine.com
How Does Climate Change Threaten Your Neighborhood A New Map Has The Details

How Does Climate Change Threaten Your Neighborhood? A New Map Has The Details.

If you’ve been wondering what climate change means for your neighborhood, you’re in luck. The most detailed interactive map yet of the United States’ vulnerability to dangers such as fire, flooding, and pollution was released in early October by the Environmental Defense Fund and Texas A&M University. The fine-grained analysis spans more than 70,000 census ...
yaleclimateconnections.org