Geomaticians

Visualization

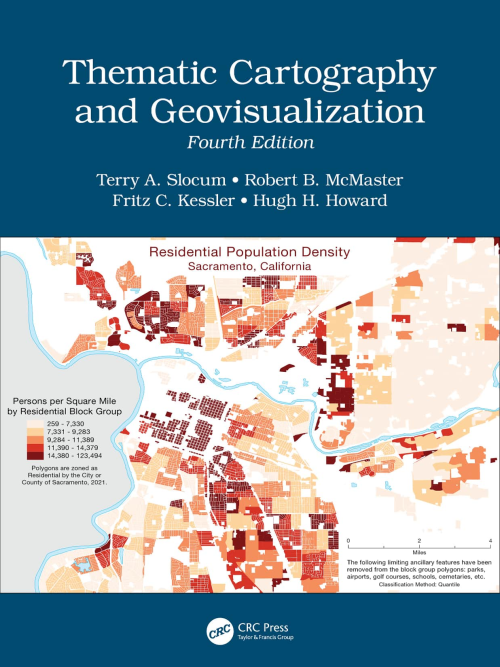
Thematic Cartography and Geovisualization, Fourth Edition

Thematic Cartography and Geovisualization

This comprehensive and well-established cartography textbook covers the theory and the practical applications of map design and the appropriate use of map elements. It explains the basic methods for visualizing and analyzing spatial data and introduces the latest cutting-edge data visualization techniques. The fourth edition responds to the extensive developments in cartography and GIS in ...
routledge.com
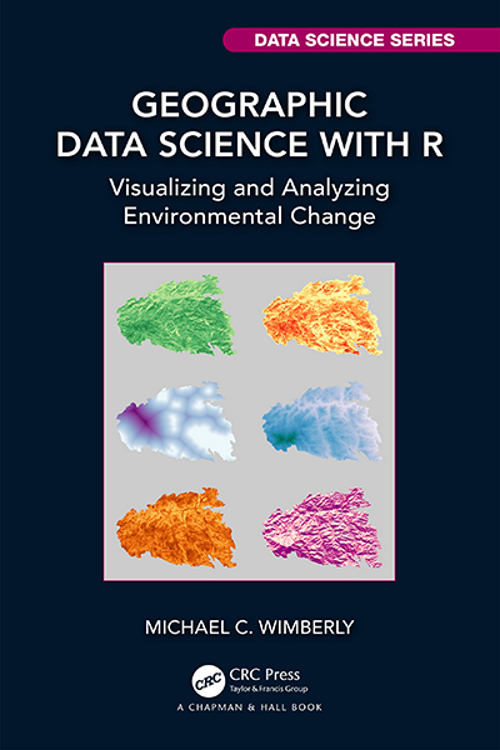
Geographic Data Science with R Visualizing and Analyzing Environmental Change

Geographic Data Science with R: Visualizing and Analyzing Environmental Change

The burgeoning field of data science has provided a wealth of techniques for analyzing large and complex datasets, including methods for descriptive, explanatory, and predictive analytics. However, actually applying these methods is typically a small part of the overall data science workflow. Other critical tasks include screening for suspect data, handling missing values, harmonizing data ...
bookdown.org
R for Geographic Data Science

R for Geographic Data Science

The materials included in this book have been designed for a module focusing on the programming language R as an effective tool for data science for geographers. R is one of the most widely used programming languages. It provides access to a vast repository of programming libraries, covering all aspects of data science, from data ...
sdesabbata.github.io
Introduction to GIS Programming and Fundamentals with Python and ArcGIS

Introduction to GIS Programming and Fundamentals with Python and ArcGIS®

Combining GIS concepts and fundamental spatial thinking methodology with real programming examples, this book introduces popular Python-based tools and their application to solving real-world problems. It elucidates the programming constructs of Python with its high-level toolkits and demonstrates its integration with ArcGIS Theory. Filled with hands-on computer exercises in a logical learning workflow this book ...
routledge.com
The Grammar of Graphics

The Grammar of Graphics

Presents a unique foundation for producing almost every quantitative graphic found in scientific journals, newspapers, statistical packages, and data visualization systems Introduction How To Make a Pie Data Variables Algebra Scales Statistics Geometry Coordinates Aesthetics Facets Guides Space Time Uncertainty Analysis Control Automation Reader Coda Leland Wilkinson Print: 9780387245447 Online: 9781441920331
link.springer.com
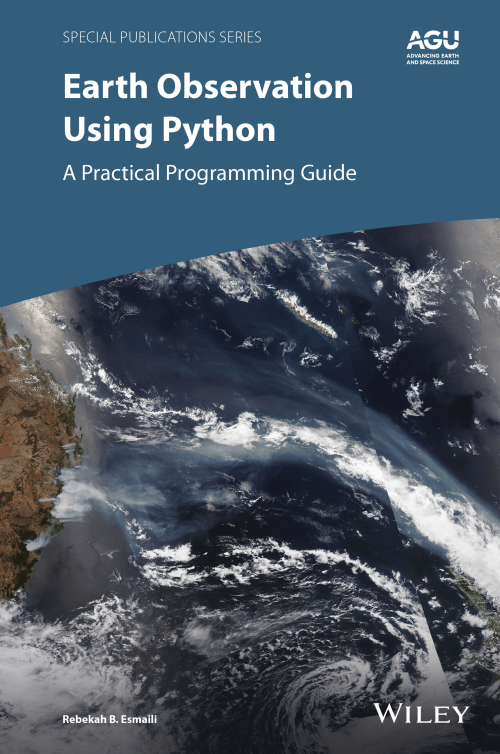
Earth Observation using Python A Practical Programming Guide

Earth Observation using Python: A Practical Programming Guide

Thousands of satellite datasets are freely available online, but scientists need the right tools to efficiently analyze data and share results. Python has easy-to-learn syntax and thousands of libraries to perform common Earth science programming tasks. Earth Observation Using Python: A Practical Programming Guide presents an example-driven collection of basic methods, applications, and visualizations to ...
wiley.com
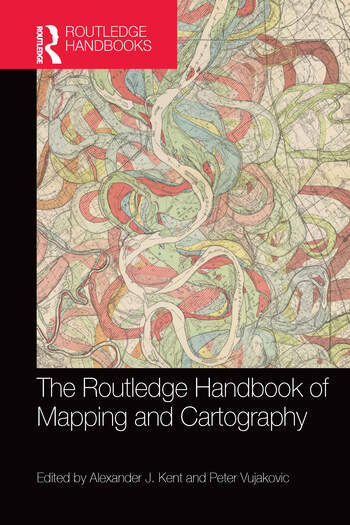
The Routledge Handbook of Mapping and Cartography

The Routledge Handbook of Mapping and Cartography

This new Handbook unites cartographic theory and praxis with the principles of cartographic design and their application. It offers a critical appraisal of the current state of the art, science, and technology of map-making in a convenient and well-illustrated guide that will appeal to an international and multi-disciplinary audience. No single-volume work in the field ...
routledge.com
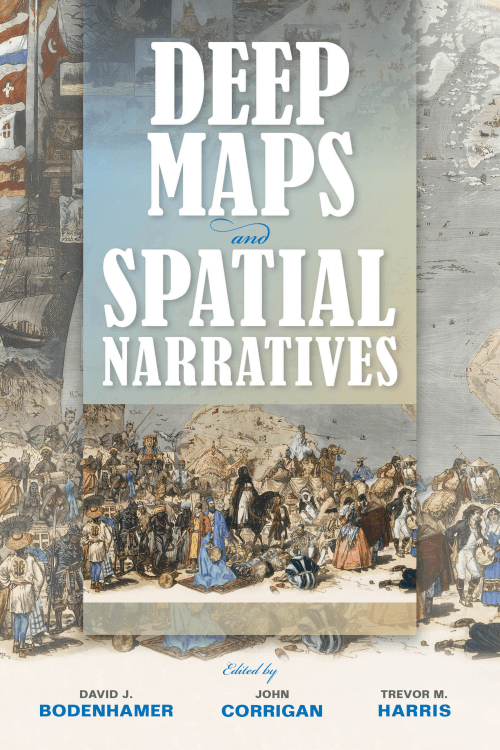
deep maps and spatial narratives 2

Deep Maps and Spatial Narratives

Deep maps are finely detailed, multimedia depictions of a place and the people, buildings, objects, flora, and fauna that exist within it and which are inseparable from the activities of everyday life. These depictions may encompass the beliefs, desires, hopes, and fears of residents and help show what ties one place to another. A deep ...
jstor.org