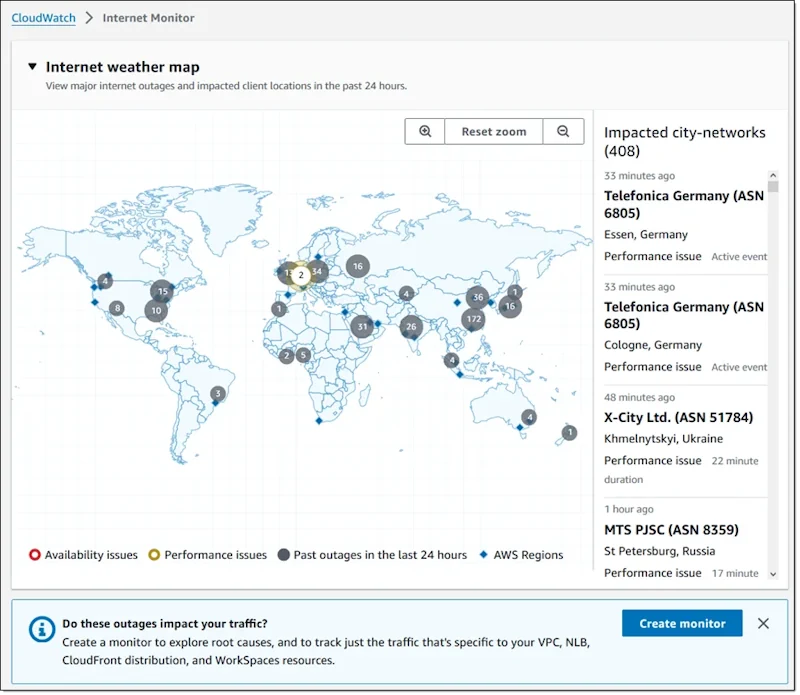
AWS recently announced the availability of the Internet Weather Map, a new feature of CloudWatch that displays a 24-hour global snapshot of internet latency and availability outages. This new map offers a worldwide perspective on Internet conditions, allowing users to zoom in and analyze performance and availability problems in specific cities or with particular service providers.
Red and yellow circles on the Internet Weather Map indicate current issues affecting availability and performance, respectively, while grey circles represent resolved issues within the past 24 hours.
Each issue affects a specific city-network, identified by a combination of location and Autonomous System Number (ASN), typically corresponding to an individual ISP. According to the FAQ page, the map updates every 15 minutes, disregarding short-lived events lasting less than 5 minutes.